Have you ever wanted to make a Weatherproof Weather and Air Quality System that transmits its edge-collected data long-range through LoRa (up to a 10Km range) and then have that data automatically uploaded to the Internet to be gorgeously visualised on an easily accessible data dashboard? And have you wanted it to be battery-powered and automatically scheduled to turn on and off? And for all software aspects to be completely FREE? Then I present to you a great way to go about it.
See the installed Raspberry Pi Pico LoRa Capable Weather and Air Quality Station below, as well as a snippet of the Visual Data Dashboard, which lets you easily access, store and observe the transmitted data.


Pretty, pretty cool hey! See the contents of this project below.
- What You Need
- How It Works and What It Can Do
- Hardware and Case Assembly
- Connecting Your The Things Network Device To DataCake
- Create a Dashboard in DataCake
- DataCake Extra Features (Public Dashboard, Periodic Data Email, Threshold Alerts, and Out of Battery Alert)
- Downloads
As always if you have any questions, queries, or things you'd like me to do with this system, please let me know your thoughts!
What You Need
Now if you've got this far I bet you're wondering what's going on under the hood of that Weatherproof Stevenson screen case. So below is a list of all components needed to make this project a reality.
- Raspberry Pi Pico (in my case I have used a Pico with female headers that point upwards which are the best for this project).
- Makerverse LoRa-E5 Breakout Module
- LoRa Capable Antenna
- Makerverse Nano Power Timer HAT for Raspberry Pi Pico
- PiicoDev Air Quality Sensor
- PiicoDev Atmospheric Sensor
- PiicoDev Cables
- Male to Female Jumper Cables
- 3 X AAA Battery Holder
- 3 AAA Batteries
- Waterproof (Stevenson Screen) Case
- Nylon M2.5 Screw and Stand-off Set
- MicroUSB to USB Cable (Must be able to transfer Data!)
- A Desktop Computer to Program the Raspberry Pi Pico (Mouse and Keyboard too!)
Below is an annotated overview of all the hardware components connected with the main waterproof cover removed, both front and back. The weatherproof cover fits perfectly on top of the 3D-printed and laser-cut mounting and twists/locks into place. The STL and SVG Files needed to create these mounting components are found at the bottom of this project page in the downloads section.

How It Works and What It Can Do
The following is exactly what is going on inside the system (it may sound complex but this project will demonstrate exactly how to reach this endpoint step by step). The 3 X AAA batteries are plugged directly into the Makerverse Nano Power Timer HAT (Hardware Attached on Top). Upon completion of the Main Programming Script (meaning data has been transmitted) this Timer HAT will switch off all other hardware and go into a deep sleep. I have set SW1 on the top of the PCB of the Power HAT to be On. Doing so will turn on the Raspberry Pi Pico every hour on the dot. The timer HAT consumes a (really tiny!) 35nA whilst in deep sleep during this period. See this Timer HAT in the image below.

Then once an hour has passed this Timer HAT will bring the project back to life. As soon as the Raspberry Pi Pico is provided power, through the Power Timer HAT, it will accurately measure Temperature, Humidity, and Air Pressure, provide an Air Quality Index number and measure the Volatile Organic Compounds and Carbon Dioxide amounts in its direct environment. It does this thanks to the BME280 and ENS160 Sensors on the chosen Piicodev Modules. See these modules in the image below.

Then in a blink of an eye, it will transmit that data to a LoRa Gateway via the Makerverse LoRa-E5 Module (see it in the image above). This data gets intercepted by The Things Network, uploaded to the internet, and pushed into DataCake. DataCake creates an (easily and fully customisable) Visual Data Dashboard which can be freely viewed by any internet device! Hit up the Visual Data Dashboard Website that I've chosen to make publicly accessible here. Simply as soon as the edge collected data transmits it goes into The Things Network it shows up in this dashboard. See the full dashboard, showing the current data, historical data, the device, and the location of the device, in the image below!

Better yet Datacake enables allows us to schedule periodic emails. This means each week I will receive a CSV (Excel) sheet of all the data collected over the week straight into my email. That means we won't lose any historical data ever. Worth noting here, the Free Version of DataCake allows you to have two unique devices attached to each account and it will retain your data online for 1 week (know that you can pay them to have more devices and more data retention).

Also, DataCake will let you set up thresholds triggers. I have it set up to send me an email whenever the Air Quality Index number gets higher than 5. That way I know the instant there is something potentially dangerous going on. Completely free of charge. You can even add phone credit to DataCake and have them send you a direct text message. Know that the mobile SMS feature costs money whereas the Email Warning is completely free.
Currently, experiments are undergoing to see how long it will take for this system to drain the 3 x AAA batteries when under full operation. There is space inside the Weather-Proof housing for larger batteries so that bridge will be crossed once we have some live tests completed.
Hardware and Case Assembly
Apart from the Makerverse Nano Power Timer HAT and the case all other components and programming are the same as the | Where to Now | section of the guide Raspberry Pi Pico with LoRaWAN and The Things Network. See that guide for an assembly guide which has a deep explanation as to why and what is being connected to each other if you need it. Know that you will need to upload the different | main.py | script to your Raspberry Pi Pico. This script does everything that the | Where To Now | section did and adds onto it a command to deep sleep the Makerverse Nano Power Timer. Know that all scripts required for this project can be downloaded freely in the download section at the bottom of this project page.
Now to replicate this project, below is a complete wiring schematic. Hook up the components as you see in the image below.

To aid assembly below are some close-up images of the build, wiring, and wire management so you too can keep the setup tidy. If you have any wires sticking out they will catch on the Stevenson Case and not let it close correctly. Be aware that you are clamping the 3D-printed (made from Ultimaker Tough PLA) and Laser cut components together using two M2.5 Screws. Also that the Raspberry Pi Pico and Makerverse power timer clip into each other through the laser cut component. Also, be aware of the orientation in that you will want to solder your electronic's headers.

Connecting Your The Things Network Device To DataCake
Below will demonstrate exactly how to weave the virtual fabric between these two systems. This will assume you have completed the process outlined in Raspberry Pi Pico with LoRaWAN and The Things Network and can successfully send data to The Things Network from your edge device.
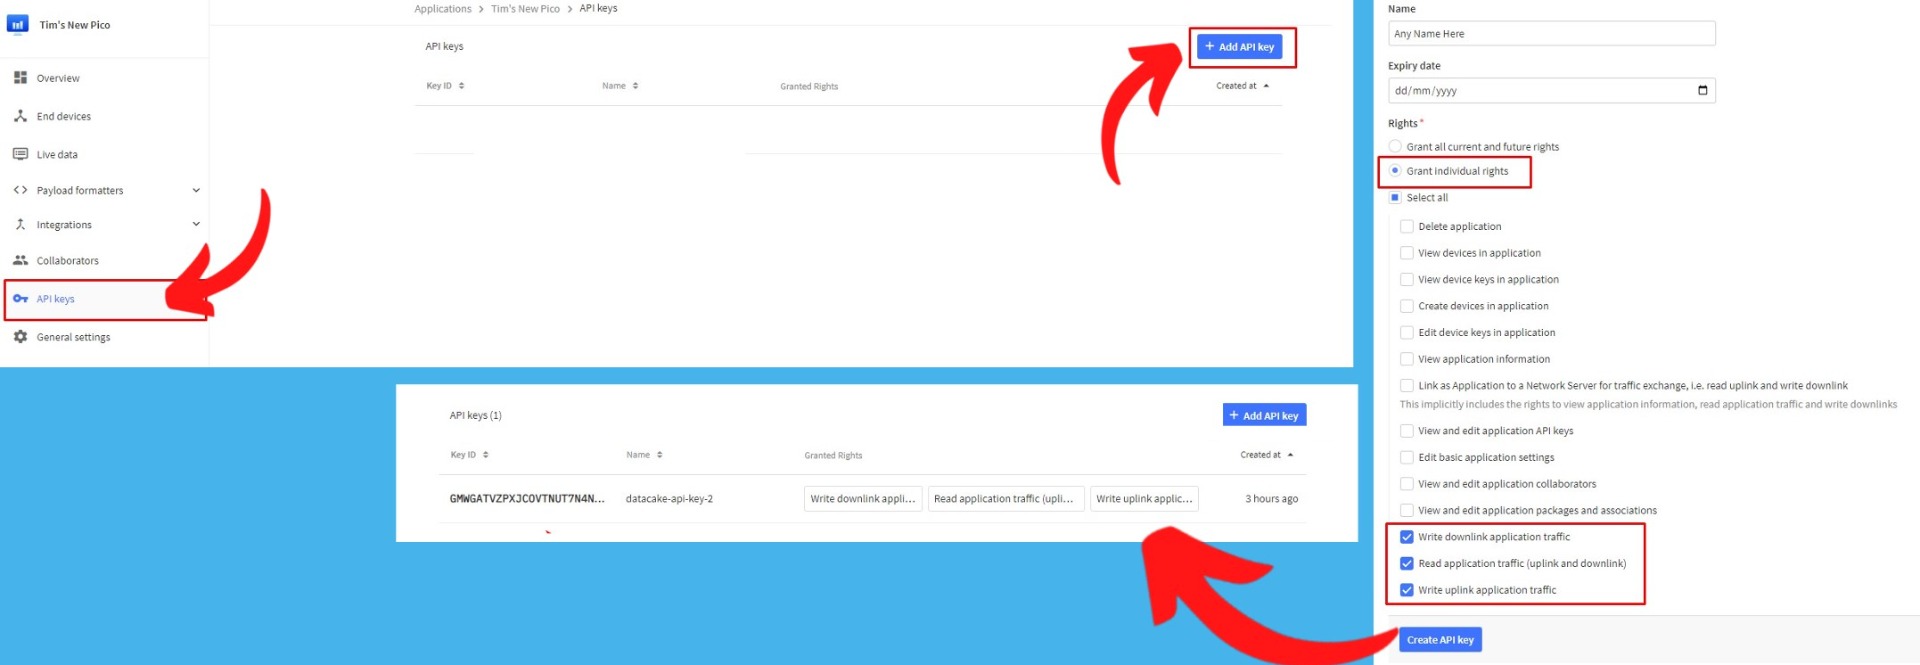
Start by setting up an API key. Jump into your Console of The Things Network and click on API Keys found on the left of the screen. Click | Add API key | and fill out the form as you see me doing below. Make sure to click the options that I have clicked.
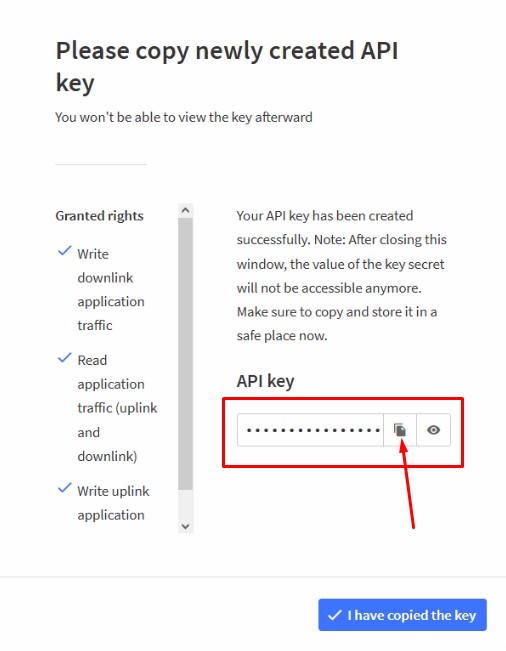
This will create a special API Key and throw up a window like the one below. Make sure to copy it to your clipboard and save that API key. We will need it very soon.
Now it is time to create an account with DataCake. Click this highlighted link to start the process. This service will facilitate our Data Dashboard. See this process being filled out below.

Once you have signed in your webpage will look like the below image. From here click | + Add Device |.

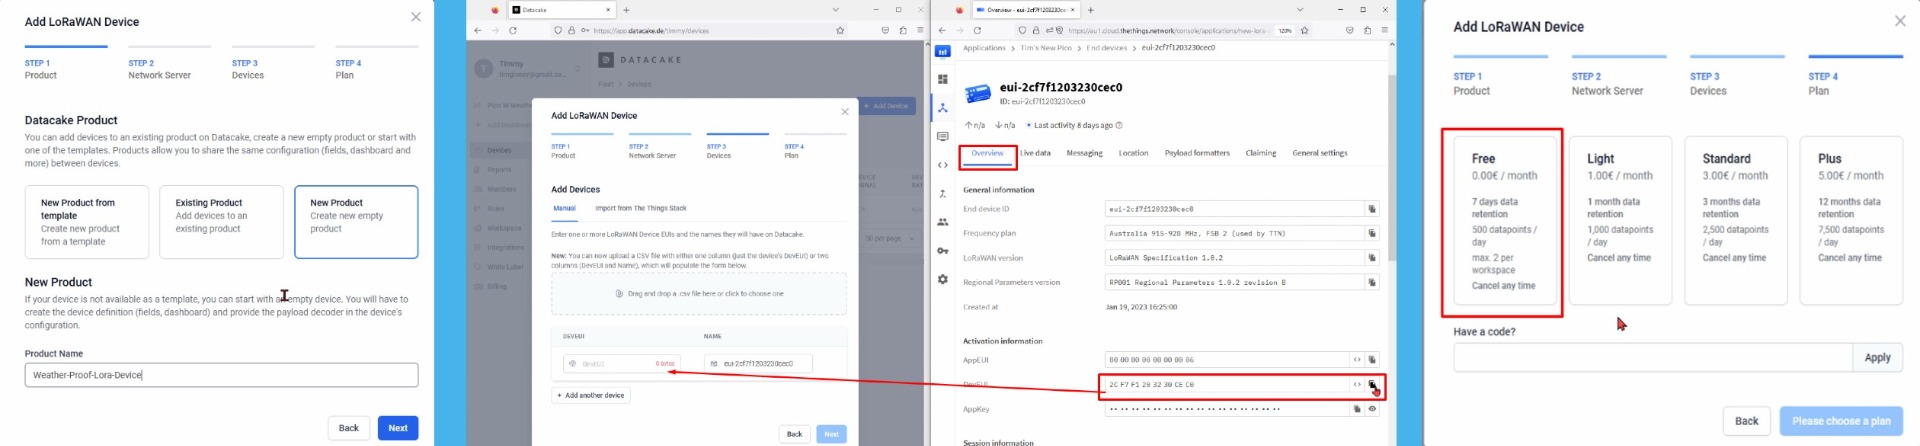
Below shows the steps to take to add a LoRaWAN Device to this. When you get to | Stage 2 | select | The Things Stack V3 |. Be ready with your | DevEUI | number which you can see how to find in The Things Network Console in the image below.
As soon as you finish that wizard below is the | Dashboard | page that will be presented to you. Click on | Configuration |.

Now fill out the configuration page appropriately. When you get to LoRaWAN section click the button | Change | found next to The Things Stack V3. See this in the image below.

With that button clicked you will now have this form. Fill it out in a similar manner to me. The TTI API Key is the one we created at the top of this chapter in the project. All other numbers or URLs can be found from your The Things Network Console. This is a great website to double-check to make sure everything is going correctly.
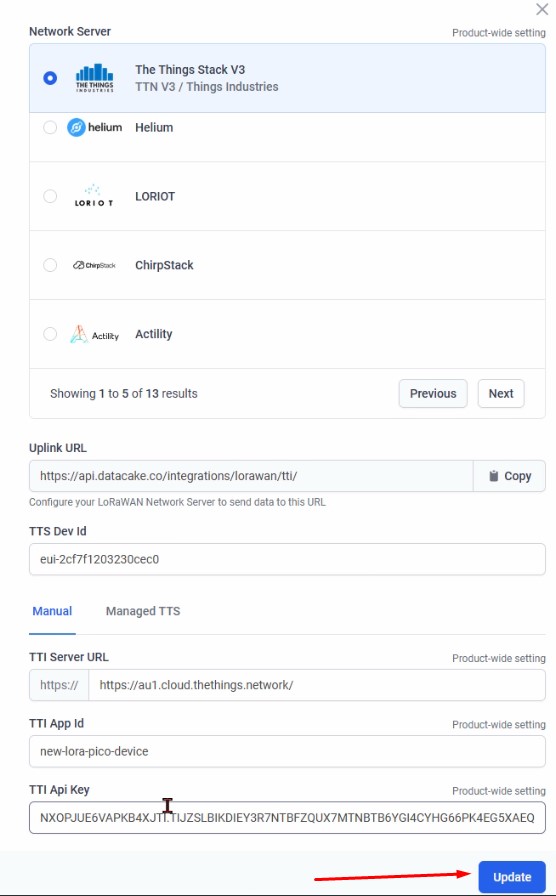
With that done and everything happy it will now look like this image below

We are now at the Payload Decoder section of the Configuration. We require a Javascript Decoding script so we can turn our Data into numbers readily understood by DataCake. Doing so will make creating a beautiful dashboard possible. The Javascript you need is found below. Copy and paste it into the Coding section as you can see I have in the image further below. You can even test the script with the example LoRa Payload I left at the top of the example.
//example payload - 313234383231303036343830343032373430303733343030393333

function Decoder(payload, port) {
  // Initialize the data object
  var data = {};

  // Parse the temperature sign
  data.Temperature_Sign = parseInt(payload[0]-48);

  // Parse the temperature in Celsius
  data.Temperature_Celsius = (
    10*(payload[1]-48) +
    1*(payload[2]-48) +
    0.1*(payload[3]-48) +
    0.01 *(payload[4]-48)
  );

  // Parse the pressure in hPa
  data.Pressure_hPa = (
    1000*(payload[5]-48) +
    100*(payload[6]-48) +
    10 *(payload[7]-48) +
    1* (payload[8]-48) +
    0.1* (payload[9]-48)
    + 0.01 *(payload[10] -48)
  );

  // Parse the relative humidity percentage
  data.Relative_Humidity_Percentage = (
    100*(payload[11]-48) +
    10*(payload[12]-48) +
    1 *(payload[13]-48) +
    0.1*(payload[14]-48) +
    0.01*(payload[15]-48)
  );

  // Parse the air quality index
  data.AirQualityIndex = 1 *(payload[16]-48);

  // Parse the volatile organic compounds in ppb
  data.VolatileOrganicCompounds_ppb = (
    10000*(payload[17]-48) +
    1000*(payload[18]-48) +
    100 *(payload[19]-48) +
    10*(payload[20]-48) +
    1*(payload[21]-48)
  );

  // Parse the environmental CO2 level
  data.EnviromentalCO2_ppb = (
    1000*(payload[22]-48) +
    100*(payload[23]-48) +
    100 *(payload[24]-48) +
    10*(payload[25]-48) +
    1*(payload[26]-48)
  );

  // If the temperature sign is 2, make the temperature negative
  if (data.Temperature_Sign == 2) {
    data.True_Temperature_Celsius = data.Temperature_Celsius * -1;
  }else if (data.Temperature_Sign == 1) {
    data.True_Temperature_Celsius = data.Temperature_Celsius * 1;
  }


  //Final Formatting of data
  Temperature = data.True_Temperature_Celsius
  Humidity = data.Relative_Humidity_Percentage
  Pressure = data.Pressure_hPa
  AirQualityIndex = data.AirQualityIndex
  VolatileOrganicCompounds = data.VolatileOrganicCompounds_ppb
  EnviromentalCO2 = data.EnviromentalCO2_ppb


  //Below demonstrates how to create Dictionary Values for the data

  //data.HUMIDITY = { name: "Humidity", value: data.Relative_Humidity_Percentage };
  //data.TEMPERATURE = { name: "Temperature", value: data.True_Temperature_Celsius };
  //data.PRESSURE = { name: "Pressure", value: data.Pressure_hPa };
  //data.AIRQUALITY = { name: "Air Quality Index", value: data.AirQualityIndex };
  //data.VOC = { name: "Volatile Organic Compounds", value: data.VolatileOrganicCompounds_ppb };
  //data.CO2 = { name: "Environmental Carbon Dioxide", value: data.EnviromentalCO2_ppb };


// Return the weather data as fields so that datacake can store them correctly
  return [
    //data: data,
      {
    field: "TEMPERATURE",
    value: Temperature
  },
  {
    field: "PRESSURE",
    value: Pressure
  },
  {
    field: "HUMIDITY",
    value: Humidity
  },
  {
    field: "AIRQUALITY",
    value: AirQualityIndex
  },
  {
    field: "VOC",
    value: VolatileOrganicCompounds
  },
  {
    field: "CO2",
    value: EnviromentalCO2
  }
  ];
}

If your system is looking like above know that your getting really really close. Scroll down a section lower and you will see the Fields Section. For each measurement that we want to capture we will need to fill out a unique field for them. Do so for each unique piece of data by clicking the | + Add Field | button.

Below shows the wizard field being filled out for Temperature.

Then once all the fields are complete Run the | main.py | Script on your Raspberry Pi Pico. All going well the edge collected data from it will be now present in the completed Field List just like the image below. Now that is a HUGE Success!

Create a Dashboard in DataCake
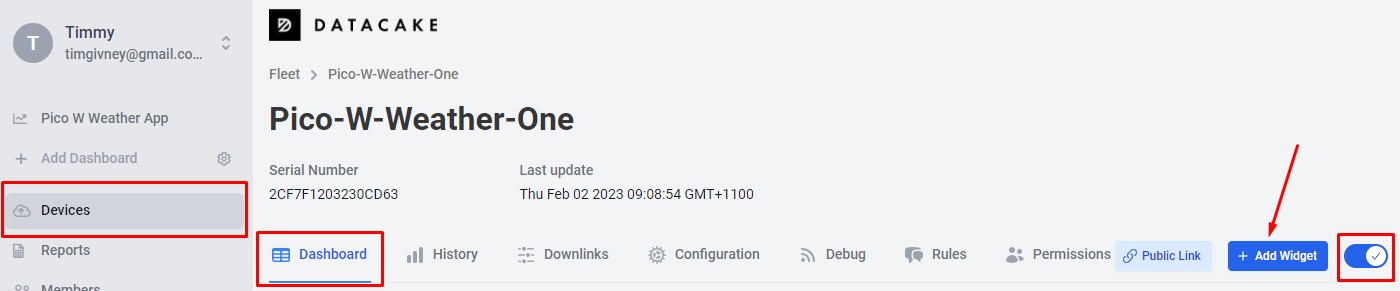
The process of filling out a complete dashboard becomes quite intuitive once you play around with it. Doing so is proper fun! For demonstration, I will create a gauge for temperature. Navigate to the Dashboard page that you can see in the image below. Click the toggle on the far right of the screen. That will enable you to edit your dashboard. Whenever you swap that toggle back it will save what you have created. Now press the | + Add Widget | button.
As soon as you do this it will open up a setting menu which you can see in the image below. There are lots of fleshed-out choices here which is awesome! From here click on | Value |.

Doing so will present the Edit Value Widget window. See it in the image below.

Now fill out all the tabs so it looks like what I have below.
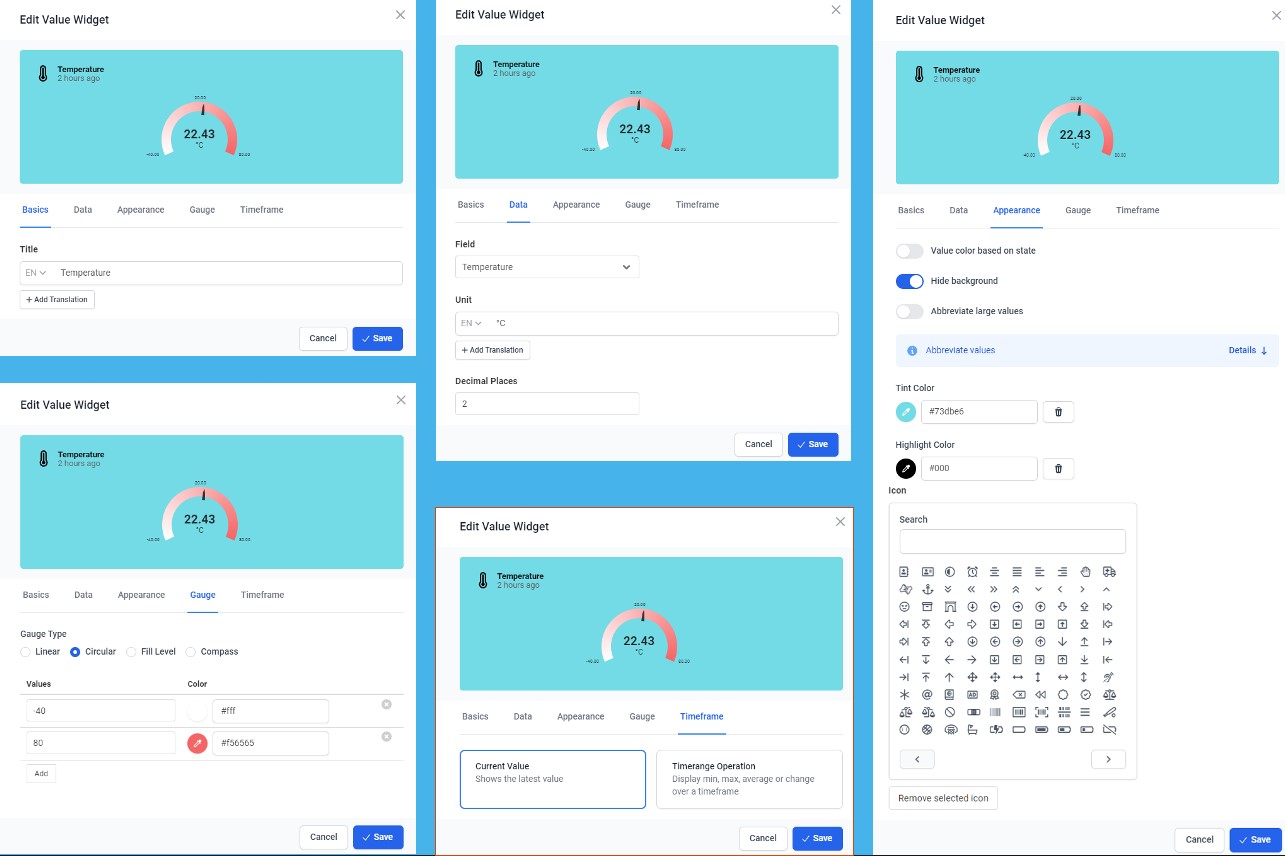
With that complete click Save and Untoggle that top right slider. You have now created a Temperature Widget showing the most up to date Temperature! It also acts as a Gauge moving up and down smoothly as new data comes into it. It shows the Max and Min range of the BME280 Chip on the PiicoDev Atmospheric Sensor so it will always provide accurate readings. See it in the image below! Continue forwards using this same method and your dashboard will be fully fleshed out in no time.

Rinse and repeat for the other data worth displaying. Once completed your dashboard can look like the image below.

Know that you can also set up Mobile Friendly Webpages using exactly this same method! Check out the one I made below.

DataCake Extra Features (Public Dashboard, Periodic Data Email, Threshold Alerts and Out of Battery Alert)
Setting up a public Data Dashboard Webpage is really easy, from the main Dashboard page click on | Public Link |, jump into this setting, and fill out the form that you see below. Once completed you can access your dashboard from anywhere. You can add password protection if you would like but no editing can occur on this page (keeping it safe from nefarious agents). Hit up my Data Dashboard Website here.

Setting up Periodic Emails is really easy. This will let you pull the data out of the system and have it with you forever! Click on the | Reports | button found on the left side of the screen. Fill out the Report form, add the data you want, and save it with an appropriate name. See this happening in the image below as well as the email it created for me, containing the CSV file of all the collected data over the last week.

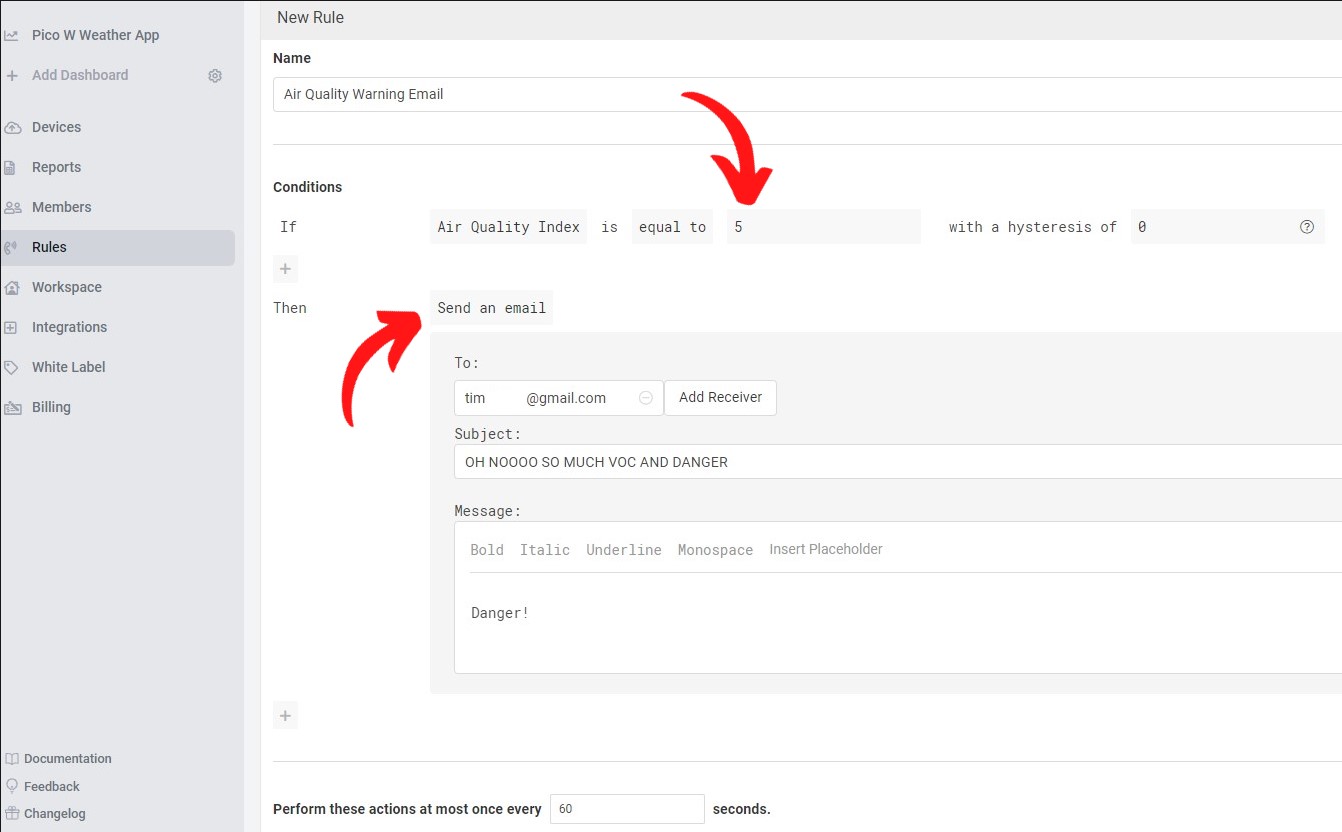
Setting up threshold triggers is really easy. Click on the |Rules| Button found on the left of the screen and fill out the form like I am in the image below. I have it set up to send me an email whenever the Air Quality Index number gets higher than 5. That way I know the instant there is something potentially dangerous going on. Make sure to save it and you will be good to go!
Out of Battery Alert or more correctly a warning that your edge data collecting device has gone Offline is easy too! Jump back to the General Configuration page for your device. Here you can set the Online Timeout amount and tick the box to Notify if the device goes offline. See that in the image below. As my device will transmit every hour on the hour I have set it to 130 minutes. That means it will only be called offline after 2 failed attempts of transmitting data. After that, we can safely assume either the batteries are dead or some nefarious agent has messed with it. Datacake will send you an email informing you of this. Nice!

Also, know that you can see all the Data that has been saved by DataCake on the | History | page as well. Below is what these look like. You can of course turn that CSV File into great graphs using software like Excel which will provide you with even more options.

Downloads & Resources
Download the Project Resources to access the code and CAD/SVG files.
Check out the precursor tutorial, which contains great information on setting up a Raspberry Pi Pico with LoRaWAN and The Things Network.

