Geophones are devices that generate electric signals proportional to the particle velocity in a sound/compression wave. More simply a Geophone is a super low frequency microphone for the ground. Geophones are used around the world to measure earthquakes, and tremours, in seismic reflection surveys (particularly for mapping subsurface geology), in safety devices (usually in relation to underground mining situations), are capable of measuring passing footsteps, and are finding a footing in the Machine Learning sphere. These are very sensitive passive devices and importantly the electrical signal they produce is Analogue. To learn a whole bunch about Analog vs Digital Signals in Electronics hit up this linked guide.
Now as incredible as Raspberry Pi Single Board Computers are by default they have no way of reading pure Analogue signals.
Thus we will need an ADC (Analogue to Digital Converter) to be the translator between these two systems. An ADC converts analogue signals into a digital representation so that they can be read and processed. Most sensors like temperature, sensor, sound or force produce analogue output voltages and the Geophone is no exception. See below for the contents of this guide.
- What you need
- Analogue Signals Into Raspberry Pi – Adafruit ADS1115 ADC
- Hardware Build
- Software Set Up
- Demonstrations – Continuous Recording and 24 Hour Data Record
- Where to Now – Taking a Photo when a Threshold is Reached
- Download Section for Scripts and Product Datasheets (Plus Some History)
Geophones are remarkably simple and ingenious devices. Geophones typically contain a spring-mounted wire-coil mass that is free to move (up and down) within the field of a case-mounted permanent magnet (see this in the image below). The active element of the device is the wire-coil mass hanging on the spring. When the ground shakes (let's say due to an earthquake) the spring-mounted mass has inertia and wants to remain still. As the Earth continues to move, the magnet displaces freely up and down around the spring-mounted mass. This displacement creates a changing magnetic field which produces a measurable electrical voltage signal in the coiled wire. These voltage changes occur very quickly. As the voltage is the result of a natural phenomenon it results in a pure analogue signal. Check out the image below for an image of the Geophone SM-24 that will be utilised in this guide, cross-sections of Geophones and an application.

Geophones have a long history, with the first of this style invented in 1906 by a Prince of the Russian Empire by the name of B. B. Galitizin. They are also referred to by different names such as jugs, pickups, and Tortugas. Some special Completely-In-Canal Hearing Aids have miniaturised geophones systems inside too. The New Zealanders utilised them in the 1940s during the war effort. It was the best way to identify and locate the direction of enemy tunnellers underground. Small high-frequency geophones exactly like the SM-24, are often used for seismic exploration and seismic measurement around the globe.
As always if you have any questions, queries, or things you'd like me to do with this system, please let us know your thoughts!
What You Need
Below is everything you need to set up your Raspberry Pi to read data from an analogue signal produced by a Geophone SM-24.
- A Raspberry Pi Palm-Sized Computer (in my case I have used a Raspberry Pi 4 Model B 2GB but this can be done perfectly with an earlier lower-spec Pi like the Raspberry Pi 3
- Geophone - SM-24
- ADS1115 16-Bit ADC – 4 Channel with Programmable Gain Amplifier (The new Revision of this board is on a black PCB, other ADCs are available and can be utilised in a similar manner)
- Micro SD Card flashed with Raspberry Pi OS
- DuPont Jumper Connectors (Female to Male and Female to Female)
- Three 1kΩ Resistors
- Solderless Breadboard
- Micro-HDMI to HDMI Cord to connect system to a Monitor
- Power Supply
- Mouse and Keyboard
Analogue Signals into Raspberry Pi - Adafruit ADS1115 ADC
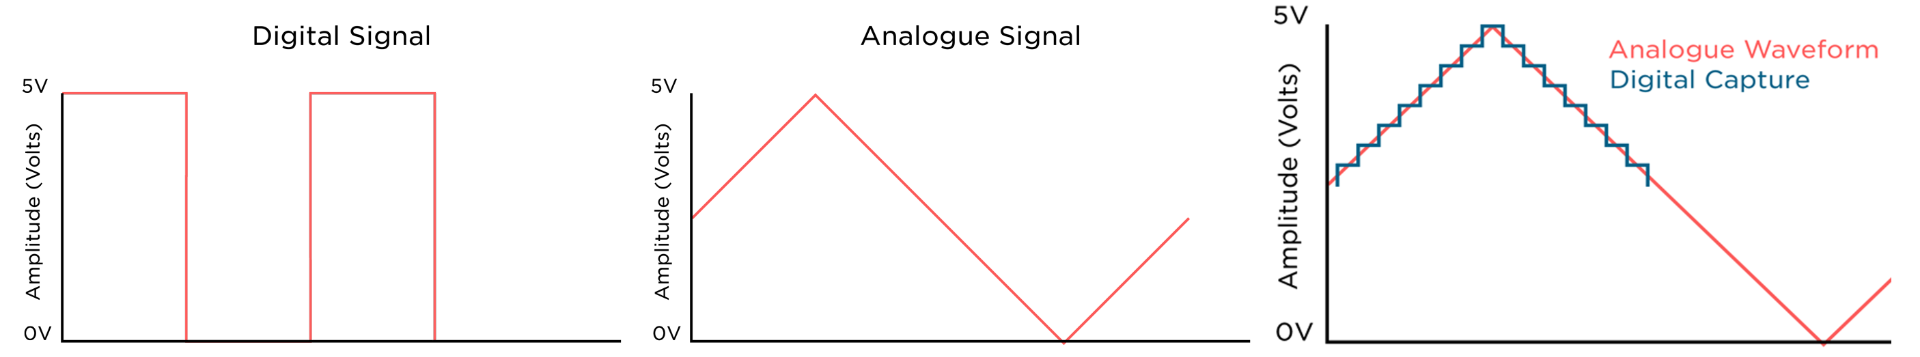
Simply, Digital Signals are binary logic signals with two distinguishable levels (1 or 0). These are represented by two voltage bands, one near ground/zero volts and the other near the supply voltage. The main focus of digital signals is data transfer. Analogue signals are everything else. They can only be truly represented as a mathematical function (if possible). They are organic signals which have an infinite resolution all the way down to the molecular level. An ADC with infinite resolution is not achievable however some modern ADCs can get pretty amazing results. Check the image below for a Digital Signal, an Analogue Signal, and a demonstration of how Analogue Signals can be read digitally.
Analogue to Digital Converters (ADCs) come in all different types, everyday makers commonly come across 12-Bit ADCs or 10-Bit ADCs. 10-Bit ADCs provide a possible bit resolution of 1024 levels (2 to the power of 10). There are also more powerful 32-Bit ADCs which have a huge bit resolution of 4,294,967,296 levels (2 to the power of 32). That provides a crazy accurate representation of an Analogue signal, so long as your computer can handle both a high sample rate and the highly detailed digital representation of the analogue data. See below for a graph demonstrating the different levels of Bits resulting in more/less accurate digital representations of analog signals.
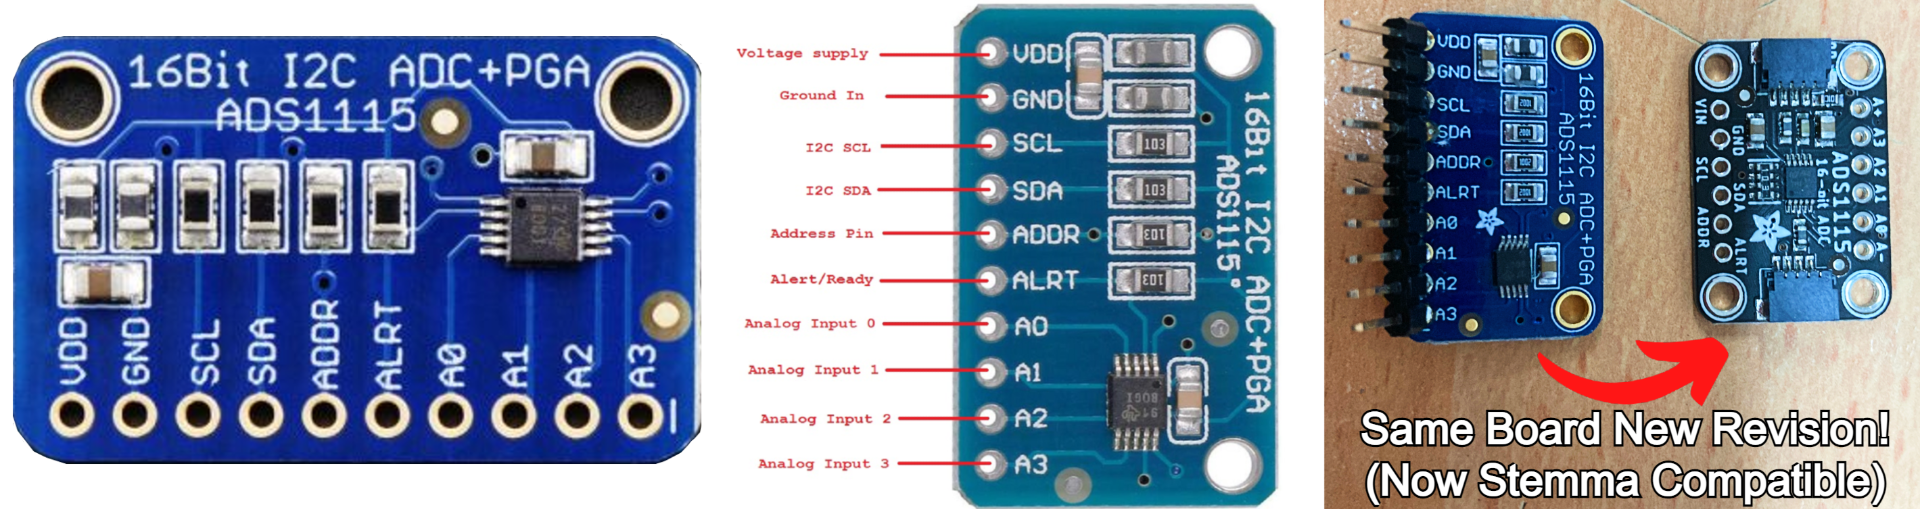
For us, we will use the Adafruit ADS1115 16-Bit ADC. See this device, a labeled pinout, and the new revision of this board on a Black PCB with Stemma connectivity in the image below. With a resolution of 0 to 65,535 possible data points (2 to the power of 16) this will be perfect for our application. Note here - More accurately as the ADS1115 Board is usually set to do Positive and Negative Values One Bit is used up for the + or - sign, resulting in a resolution of 32767. Bringing this back to the real world a 16-Bit Resolution is what CD-Roms play music at and they sound great. The sampling rate in ADS1115 can be set anywhere between 8 and 860 samples per second. Keep in mind the higher the sampling rate the less time taken by ADC to capture and convert the analog signal. This board also has a built-in gain amplifier allowing you to amplify voltage signals 2-3x to 16x times. Higher Gain values enable you to ramp up the sensitivity of the device and when effectively enables you to losslessly zoom into the signal response. For our Geophone case, we will use the maximum Gain value of 16 to max out the sensitivity.
These ADC boards are widely used with Raspberry Pi as the IC chips operate with a voltage of 3V3. The ADS1115 has four analog input channels and supports two types of data acquisition – single-ended and differential. In single-ended conversion, analog data from each of the four analog input pins are independently sampled. In the differential mode of operation, the difference between the voltages at two analog input pins is sampled. This differential mode of operation is perfect for our use case as a Geophone is an analog-producing device that produces two measurable voltages. A differential input better resists electromagnetic interference (EMI) than a single-ended input. To minimise this further you can twist/coil the wires coming from the Geophone. The twisting ensures that both wires are subject to virtually identical external influence.
The conversion (single-ended or differential) can be done in two ways with this Board. This is explained below.
- The conversion is initiated by the Raspberry Pi. The converted value is stored in a register on ADS1115. The Raspberry Pi then reads the register.
- The conversion is done by the ADS1115 continuously. The signal is sampled at a preprogrammed rate and the converted value is repeatedly updated in a register on the ADS1115. The Raspberry Pi must repeatedly read the ADS1115 register according to the programmed sampling rate. If Raspberry Pi reads the register at a lower rate it will miss several captured samples. On the other hand, when the Raspberry Pi reads the register at a higher rate it will log several redundant values for the same samples.
In the 1920s the Swedish Scientist Harry Nyquist developed his famous theorem The Nyquist Theorem. He determined that if a signal was sampled at regular intervals with at least twice the speed of the fastest movements within the signal, the signal could be reconstructed on the other end of the transmission without loss. Seismic measurement is tough to determine what the fastest movement is so I will attempt to max out all the hardware and get the best result possible using the programming language of Python. It is worth knowing that other programming languages, like C, BASIC or Assembly, will have the capacity to operate at a faster speed. The trade-off is that these programming languages are written in a less human-readable format.
Hardware Build
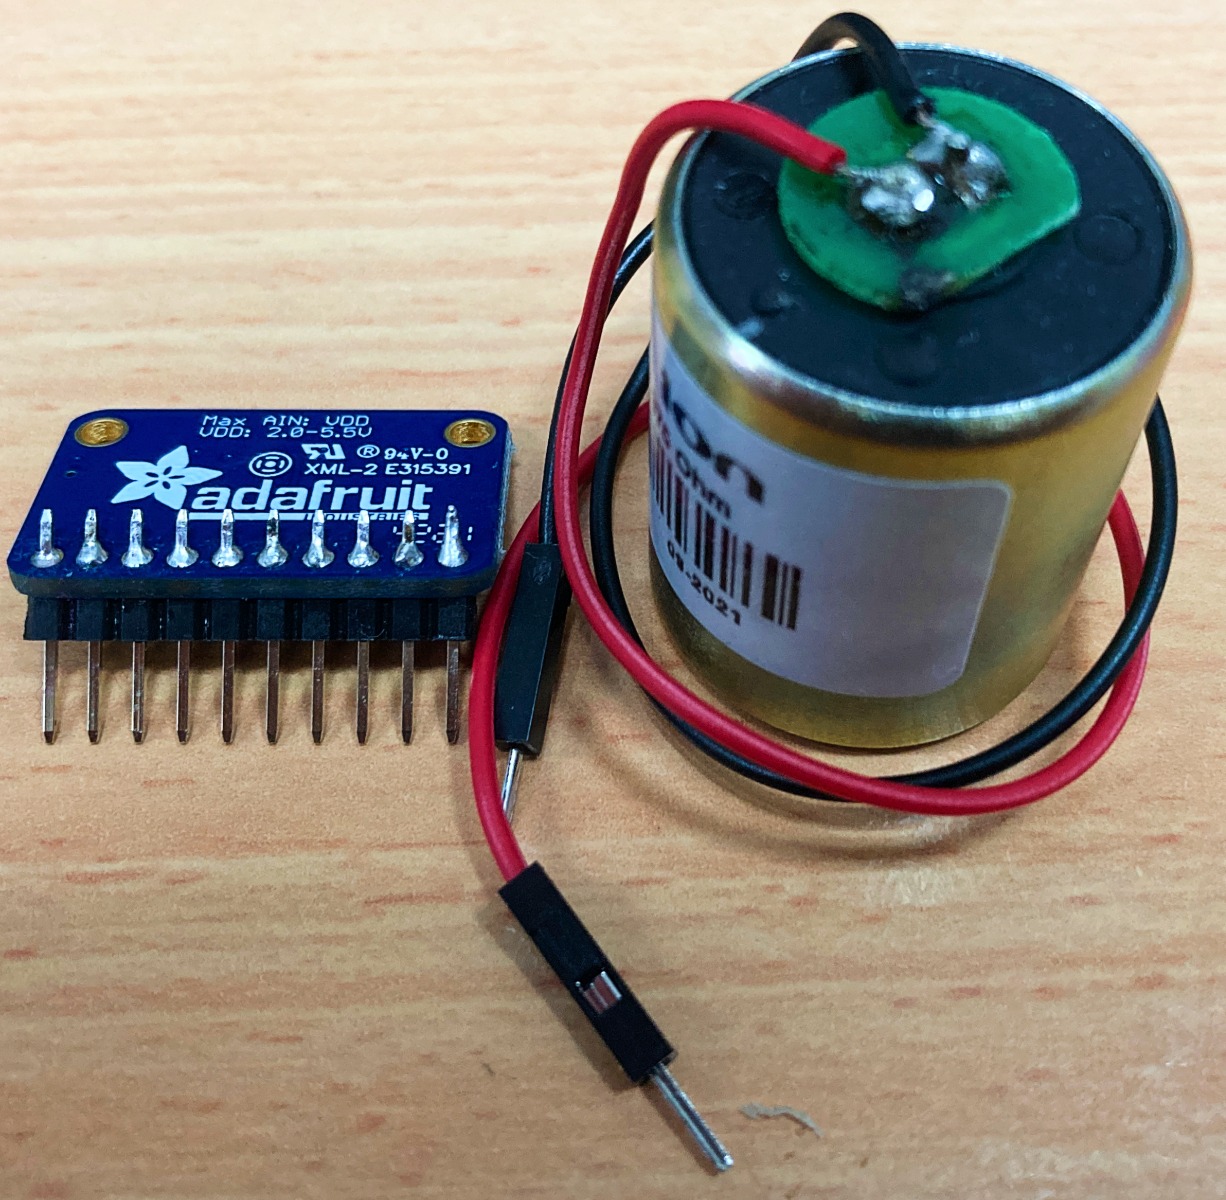
We will now build up the hardware. Start by plugging in all the connections to your Raspberry Pi 4 Model B as you would a desktop computer. Check this guide here if you need any advice on exactly how to do this. Don’t plug in the USB-C power plug just yet. Now you will need to solder headers onto the ADS1115 Board and Solder on some wire connections to the top of the Geophone SM-24. The Geophone comes with a little mini PCB board that makes soldering to the top of it significantly easier. My preference for this is to use DuPont Jumper Connectors, however, you can directly solder all components together or use whatever connections take your fancy. There are quite a few. See the image below for the soldering result that I achieved.
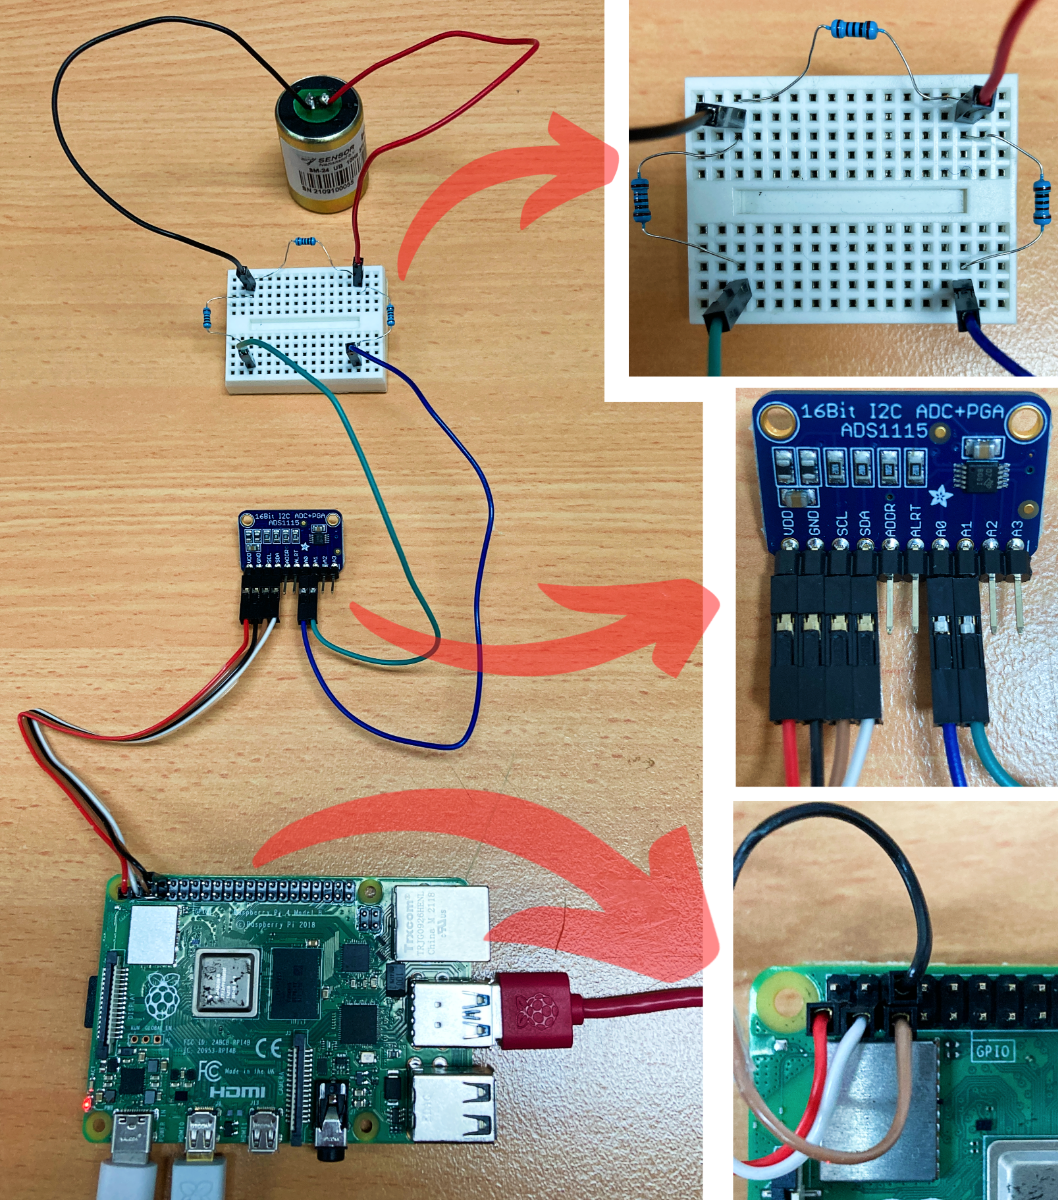
Now take a look at the below schematic. We will connect the Adafruit ADS1115 board and the Raspberry Pi 4 Model B in the exact same way. The Raspberry Pi is connected to the ADS1115 board through the GPIO pins. There are four connections. The Red one is to deliver 3.3V VDD (Voltage Drain Drain) to the ADS1115. The Black wire is to provide a GND (Ground) connection between both boards. The last two are required for I2C connection, SCL (Serial Clock) and SDA (Serial Data). The SCL is the Orange Wire and SDA is the Purple wire. The sensor can be supplied voltage from the Raspberry Pi itself, as I do here, but it must be the 3.3V connection. 5V will brick the Adafruit ADS1115 ADC Board.

Allow me a second to explain the Resistor Layout near the Geophone SM-24. The 1kΩ resistor in the middle is a calibration resistor used in accordance with the data sheet in order to flatten the response curve. See below a table taken from the SM-24 Datasheet explaining this. All datasheets are available to download at the bottom of this page.

The other two 1kΩ resistors, leading to the ADS1115 Board, are for current limiting. In a situation where the output voltage from the geophone is larger than the maximum input voltage of the ADC, these resistors will protect our system. Even if the output voltage is 10V, which is much higher than the usual Geophone's output of a couple of mV, the current would be limited to 5mA, thanks to the resistors. Thus we will not destroy the electrostatic discharge diodes (ESD) of the ADS1115 analog inputs and the system can live a long happy life. Knowing this we will now connect up the two resistor ends to the A0 and A1 on the ADC board with some jumper cables.
When everything has been connected up you can then put power into your system. Your set up should look a lot like the image below. Make sure to place the Geophone standing upright and with the barrel axially aligned to the center of the Earth (or at least within a couple of degrees). The Geophone will not capture data when upside down or accurate data when at too dramatic of an angle. There are Geophone systems that incorporate multiple axis gimballed geophones into a single system providing a true axis orientation even when shaken but we won't concern ourselves with that complexity here.
Software Set Up
With the power into to the system and the (new) first boot-up wizard complete, you will be welcomed by the Raspberry Pi Desktop. Now the Adafruit ADS1115 ADC requires I2C communication to work. By default on Raspberry Pi OS this communication method is turned off. So the first step is to turn that on.
To do this open up the Raspberry Pi Configuration menu (found using the top left menu and scrolling over Preferences) and then enable the I2C Connection found under the Interfaces tab. After enabling, reset the Raspberry Pi to lock in the change.
Now with your system rebooted and connected to the internet, open a new terminal window by pressing the black button on the top left of the screen. This will open up a terminal window. See the image below of this happening and a big red arrow pointing towards the terminal button that was pressed.
![]()
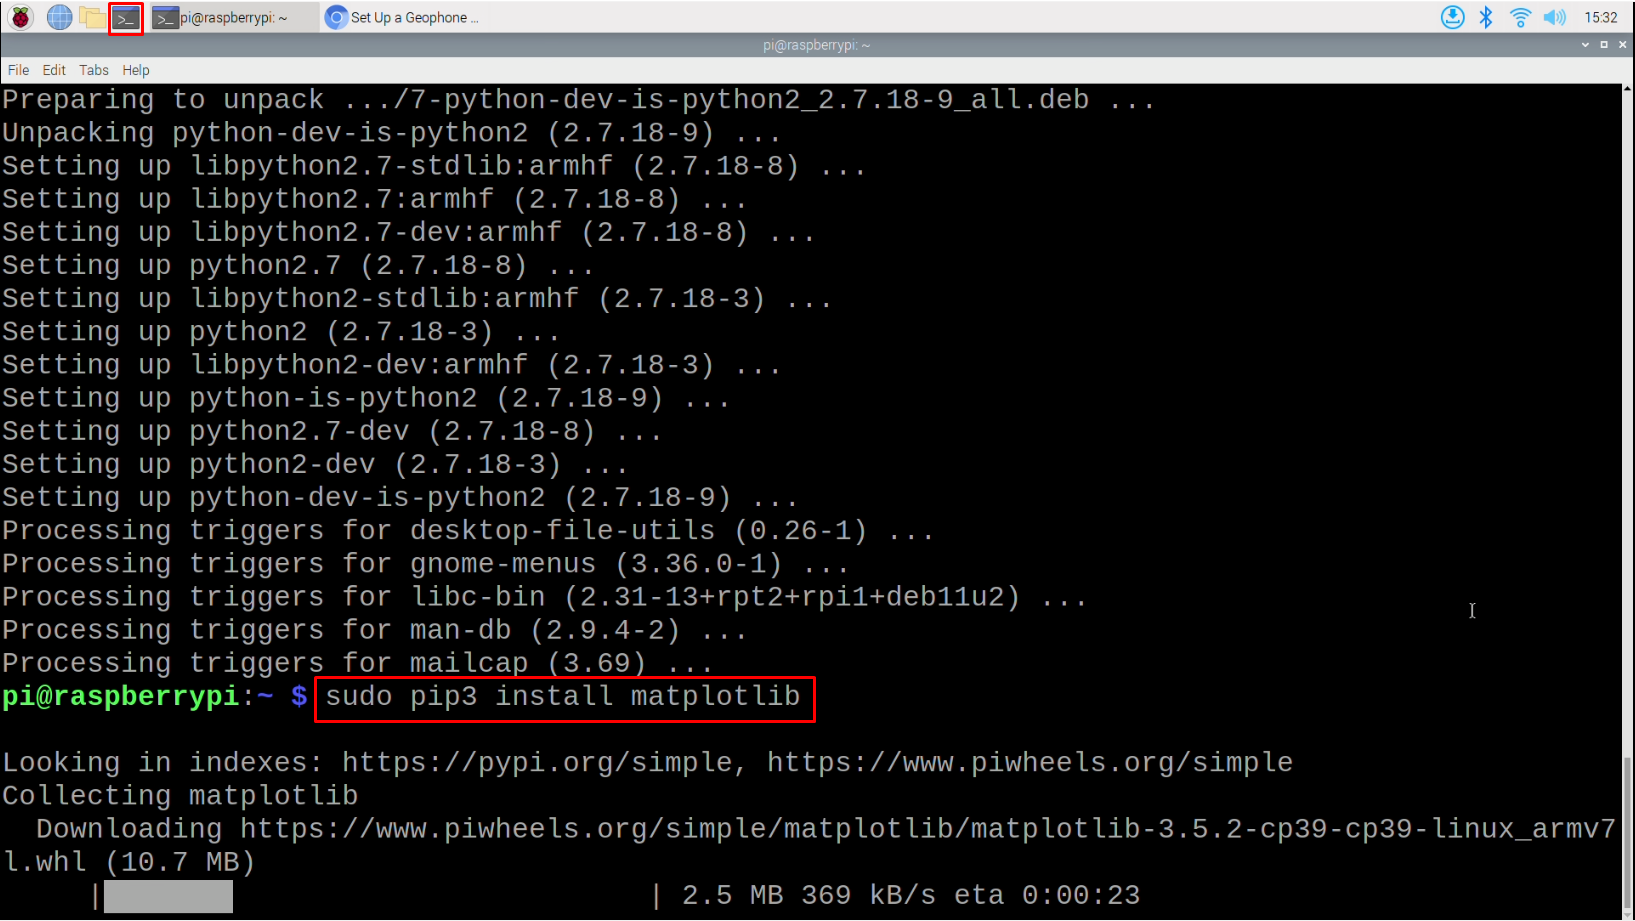
This terminal window will enable us to download from the internet the exact packages we require. So now type and enter the following lines into the terminal to get all the packages that you will need. If prompted, type and enter | Y | to continue/confirm installations. See further below an image of one of these commands being downloaded.
If you are running Bookworm OS (the default Raspberry Pi OS version for 2024 onwards), you will need to be using something called a virtual environment. If you haven't already set up the environment, you may get the "externally managed environment" error message. Setting up a virtual environment is easy and only needs to be done once and we have a very short guide on how to do that. If you have previously set up the environment, or you are running an older OS, you can skip this step.
sudo apt-get update
sudo apt-get install build-essential python-dev
sudo pip3 install matplotlib
sudo apt-get install libatlas-base-dev
pip3 install numpy --upgrade
sudo pip3 install adafruit-ads1x15
sudo pip3 install adafruit-circuitpython-ads1x15
When completed we have fully set up our Raspberry Pi Single Board Computer to work with the Geophone SM-24 and ADS1115 Board.
Demonstrations – Continuous Recording and 24 Hour Data Record
I have created some example codes that you can find and download at the bottom of this page or right here. These files will be in a Zip Folder, just extract the contents of it to wherever you'd like, the desktop is a perfectly good place. Right-click and Open any of the files with Thonny IDE to see how they were written. Thonny IDE is just a Python Interpreter Software and you can use whichever you’d prefer.
Lets start by opening up | Differential Graph Display.py |. All scripts have been extensively commented on so you can follow. With it open press the Big Green | Run | Button. As soon as you press run it will show the live output of the Geophone onto a continuously updating graph. Give the Geophone a shake and the graph will respond in turn. This data is also recorded in the shell output. The readings on the Y-Axis are the Milli-Volt Values of the Geophone outputs. The readings are coming in constantly at approximately 25 Readings each second. The Y-Axis settings in the script will prevent it from maxing out the vertical readings even when violently shaken (not that I recommend that). A Gain of 16 will be used in the script so that you can see how sensitive this device really is. It is capable of picking up light finger taps on the other side of the table.

The next script worth looking at is | Differential-Data-Collect-Gain.py |. Run this script and it will take 100 voltage data samples and store those 100 pieces of information in a CSV (Comma-Separated Values) file named | Geophone_Data.txt | with a new line between each data point. If this text file is not already created it will create this file. Also, be aware that each time you run this script it will rewrite that text file. When the millivolt data has been collected it will also print to the shell the exact amount of time it took to do it. See this script run in the image below.

If you print the data to the shell as well it will result in 100 readings from the ADC approximately each second (depending on Raspberry Pi Hardware). If you comment out all the sections that print data to the shell you can receive 100 samples even faster. Considering we are 'handicapping' ourselves with a comparatively slower programming language that is still a huge amount of data points. Conversion is initiated by the Raspberry Pi for all the scripts used in this guide. You can receive an even higher influx of data from the ADS1115 board if the data was done continuously by the ADS1115 Board. This and using another 'faster' Programming language like C or Machine Code would mean more accuracy and more data. Just don't drown in data and remember Nyquist Theorem if you are pursuing this.
To record the seismic data over an entire day with this script I created a second While Loop directly underneath the first. If you comment out the top one and uncomment the lower one it will run the While loop for an entire day. Gather all the data it can in that time and add it to the text file. When you have sufficient data or have something you want to graphically observe you can then quickly turn that data into a plot using Excel if so desired. See this change happening to the Python Script in the image below.

Most seismometers measure velocity/voltages like we are doing here. If you want displacement, you integrate the output over time, and if you want acceleration, you differentiate the output over time.
Where to Now – Taking a Photo when a Threshold is Reached
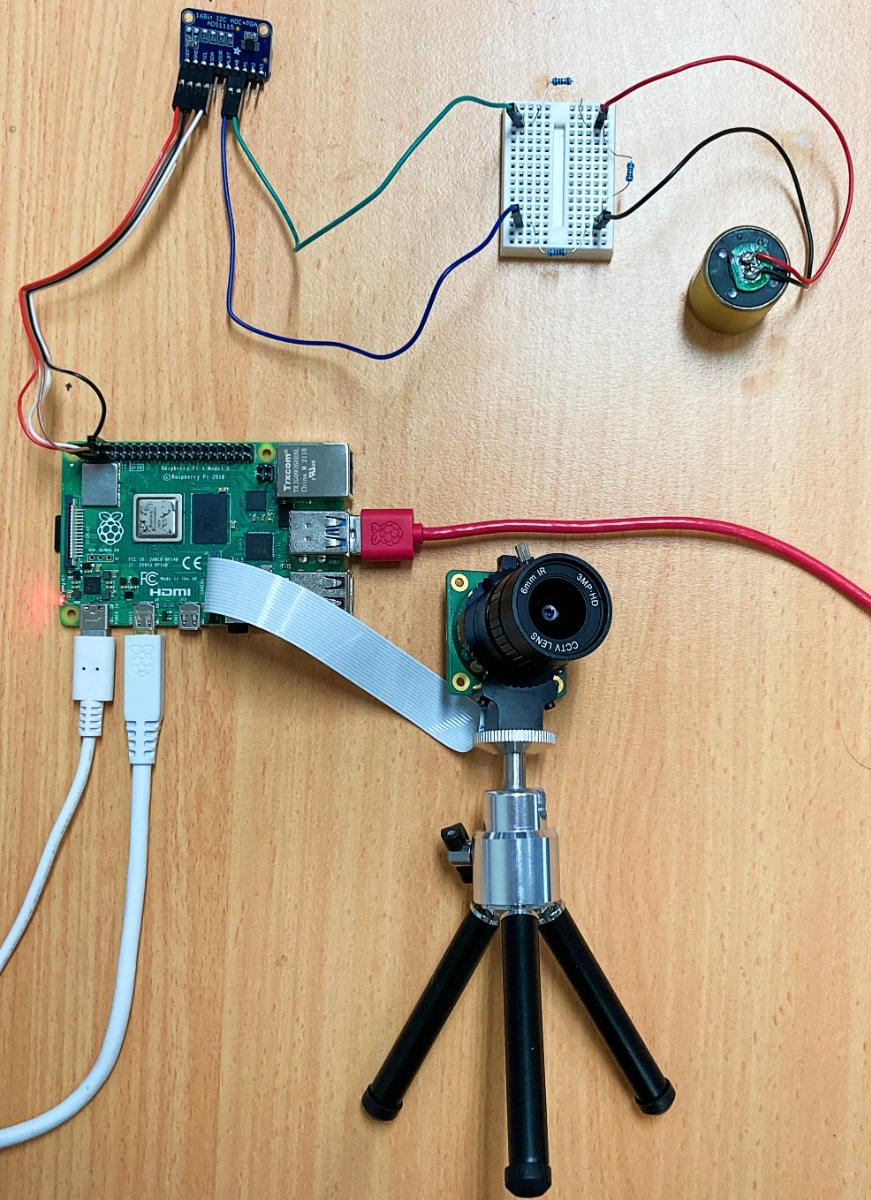
Finally, I wanted to control some attached hardware based on the Geophone. The idea is that when someone walks by the Raspberry Pi it will be aware of it via the Geophone and vibrations created by your footsteps. It will then trigger a photo to be taken of the individual walking past. To do this first, we will need to attach a Camera to the CSI port on the Raspberry Pi Single Board Computer. For a guide giving the run down on Setting up an HQ Raspberry Pi camera come check here. Once complete your apparatus should be a lot like the image below.
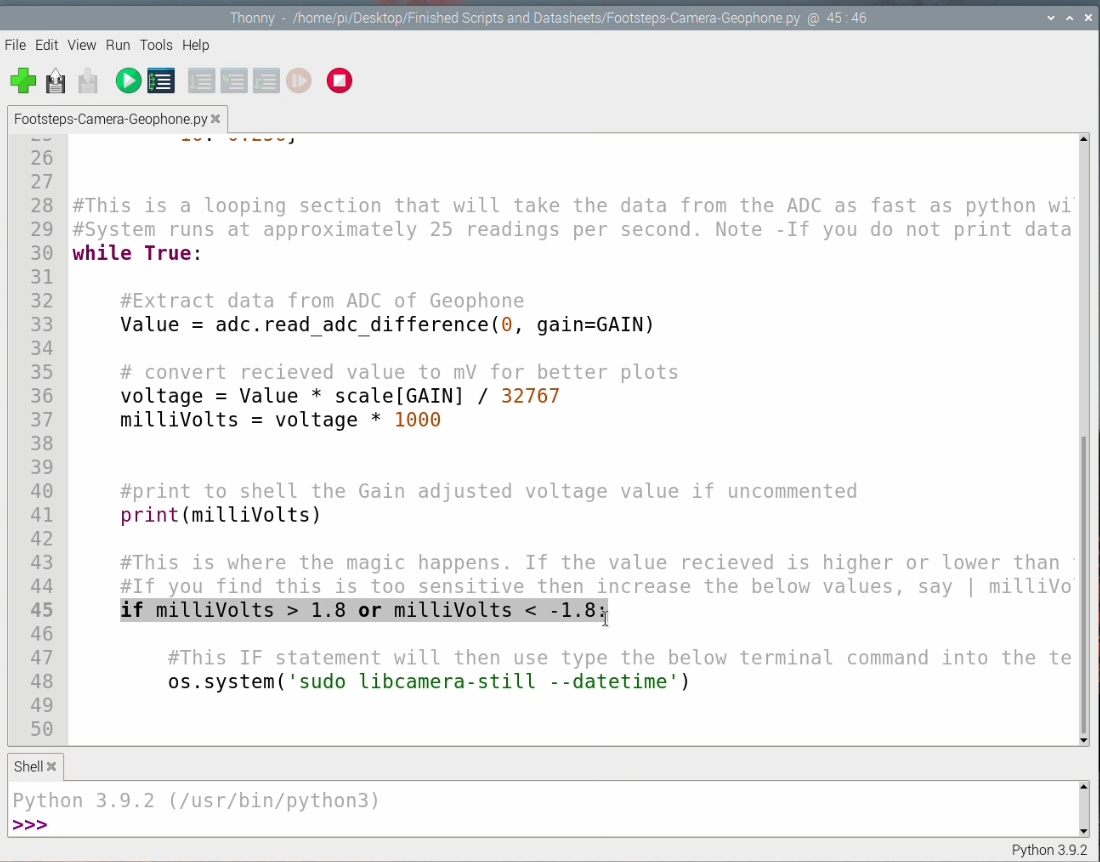
When it comes to Python scripts I adjusted a previous one to add a threshold value. The system will constantly be listening through the Geophone. Then once a certain magnitude of Geophone response is reached, it will activate the camera. The camera will then auto-adjust and take a photograph of whatever is in front of it. Then the system will revert back to listening. The script that will do this for you is named | Footsteps-Camera-Geophone.py |. Open up and run the final python script in the same manner as before, check the image below for the system automatically capturing a photo of me as I walked by out of my office (I think they're planning on barricading me inside).

This scripts works very simply. If the value of the Geophone Response goes below -30 or above 30 then it will activate the camera. The camera will then take a photo. The photo's name it is saved at will be the current Date and Time. If this value is too sensitive for your application simply adjust to higher values. Keep in mind this Geophone is picking up the vibrations through the carpet floor and the wooden table which is remarkable. See this If statement location in the code below.
This opens up an interesting world of control where devices set up behind walls, with sensors completely out of the line of sight, can still be completely aware and control attached hardware. Say you are walking through your house at night, your system will know exactly where you are and the direction you are going in your home. Then it could turn on your lights automatically, illuminating the path as you go. It also could be utilised as a secret method of tracking how many people are walking past a certain location.
Download Section for Scripts and Product Datasheets (Plus Some History)
It is lore that in AD 132, Zhang Heng of the Chinese Han dynasty invented the first seismoscope which was called Houfeng Didong Yi. This translates to 'instrument for measuring the seasonal winds and the movements of the Earth'. The description states that it was a large bronze vessel, about 2 meters in diameter. At eight points around the top were dragon's heads holding bronze balls. Then when there was an earthquake, one of the mouths of the dragon would open and drop its ball into a bronze toad at the base, making a sound and indicating the direction of the earthquake. The first earthquake recorded by this seismoscope was determined to come somewhere in the East. Days later, a rider from the east reported this earthquake.
Also, if you want a killer article on The History of the ADCs that we now take for granted check out this. Learning about the 1960s 12-Bit ADCs that was worth $8000 USD in today's money back then really makes you appreciate how far IC silicon technology has come.
Download All Scripts Explored and Product Datasheets with this Link Here

