In this guide, we are going to be learning how to use the Rd-03D radar sensor to detect and track humans in your next Arduino project. We will be looking at how it works and what you can expect from it, how to wire up and code your Arduino to interface with it, and to top it all off we will be creating a radar-style visualisation with Processing IDE. Let's get into it!
| We also have a version of this guide for a Raspberry Pi PIco and MicroPython or a Raspberry Pi 5 with Python if you want to check that out. |
If you are coming from an external site and looking for the library, you can download it here!
How the Radar Works and What Data it Outputs
The Rd-03D is a 24 GHz millimetre wave radar sensor, and it really is a testament to our current state of technology as it achieves a great deal of things for such an inexpensive device.
This sensor emits radio waves around the 24 GHz frequency and listens for the reflections that return, kind of like an ultrasonic distance sensor. However, this sensor is far more advanced. Not only does it use the time it takes for those radio waves to reflect back to measure the distance of a person (by the way those radio waves are travelling at the speed of light), but it is also listening for any shift in frequencies from the Doppler effect to measure how fast the person is moving. This is the same effect that causes a car to change pitch as it passes you and the greater the shift in pitch (caused by a shift in frequency), the the greater the speed of the car. This same principle works with radar waves bouncing off a human target. A very important note here is that this sensor will only be able to measure the speed of a target in the direction towards or away from the sensor.

On top of that, it also has 2 receiver antennas that are used to detect the angle of a target. If a radio wave is emitted it bounces off a human to the side of the sensor, as the radio wave returns to the sensor it will hit one of the antennas before the other and this is used to detect the angle of the sensor. With that radio wave travelling at the speed of light, there is less than 0.025 nanosecond between it hitting the 2 different receivers. The fastest human blink is 100,000 nanoseconds, yet it can take that incomprehensibly small time and accurately figure out the angle the person is at relative to the sensor.

But how does it only detect people (and maybe other animals that are large enough)? Well, this is really where this sensor does some magic. When it emits those radio waves, most of the objects in the room reflect - your chair, the wall, your computer, your phone, so how does it know what's human? A very streamlined explanation is that humans have unique patterns in the waves they reflect. Like how visible light (which starts at 400,000 Ghz) reflects differently on different materials, our 24 GHz radio waves reflect differently on humans. Humans are also constantly moving creatures, everything from your breathing to the slight movement in your arms creates micro-doppler shifts as they move toward and away from the sensor. Humans are a certain "brightness" to the radar and are a sea of micro-doppler shifts, and with the onboard processing, it uses these to figure out what and where a human is.
If you took this sensor back 40-50 years in time, the signal processing alone would baffle the smart people on Earth, and it would seem like magic to even a specialised radar engineer.
So with this sensor, you will be able to use 24 GHz radio waves to detect a person, how far away they are from the sensor (up to its 8-meter range), what angle they are relative to the sensor, and how far they are moving toward or away from the sensor. It should also be noted that this sensor has to be stationary - it cannot move around. We are not entirely sure why, but we guess that it runs some sort of room calibration to get a baseline reading. If you move the sensor, this calibration is thrown out of whack and it gives bad readings. Ensure that it stands still, we will talk more about mounting this later.
Now that you know how it works and what you can expect of it, let's learn how to use it!
What You Will Need
To follow along you will need:
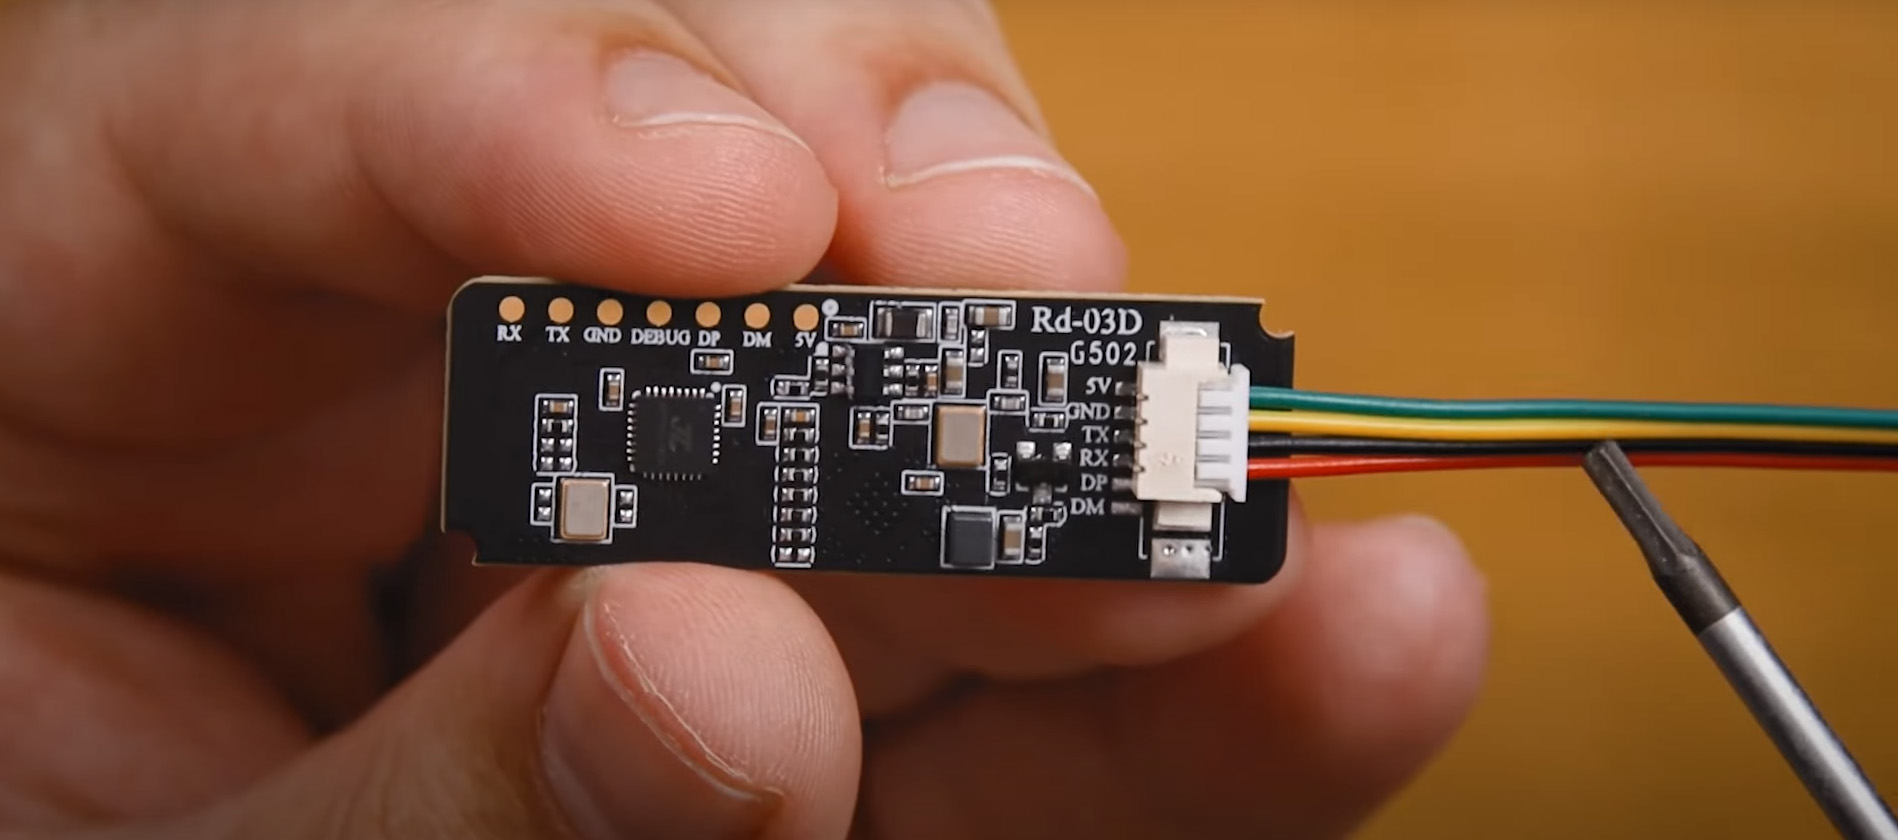
- The Rd-03D Sensor.
- A method of connecting the Rd-03D sensor. There are contact pads that you can solder your own wire to, or you can grab a jumper wire adapter for the onboard connector. The board DOES NOT come with one of these.
- An Arduino, we are using the Uno R4. We have had limited success on other Arduino boards, and only on faster models have we been able to run this. Of course with a bit of tweaking this will also happily run on an ESP32.
- Some jumper wires to connect everything with.
Connecting it to an Arduino
If you are using the jumper wire adapter, connect it to the Rd-03D. However, please note that the cable we have linked is a generic one and the colours may not match the board very well. For example, mine has red and black as the TX and RX pins, with green as the 5 Volt pin and yellow as the Ground pin. Don't rely on the colours of the cables too much here and always follow the pin label from the board instead.
First, let's power the radar. To do so we will connect the 5 Volt pin of the radar to the 5 Volt power pin of the Arduino. Then connect the Ground pin of the radar to a ground pin of the Arduino. To do so you will likely need to use a male-to-male jumper wire and this may be a good opportunity to select more appropriate coloured wires for the pins (we are using red and black wires for these).
The radar will be outputting its data through UART so let's go ahead and connect the TX pin of the radar to pin 2 of our Arduino. Pins 0 and 1 of the Arduino are the default UART pins, but they are also the same pins that the USB connection uses. If we try to use the sensor and our USB connection at the same time we will get conflicts. This issue has been fixed on a few boards (including the R4 Uno), but for the sake of compatibility, we will be using pins 2 and 3 as our UART pins and simulating it with software (using the SoftwareSerial library), more on that later in the programming section.
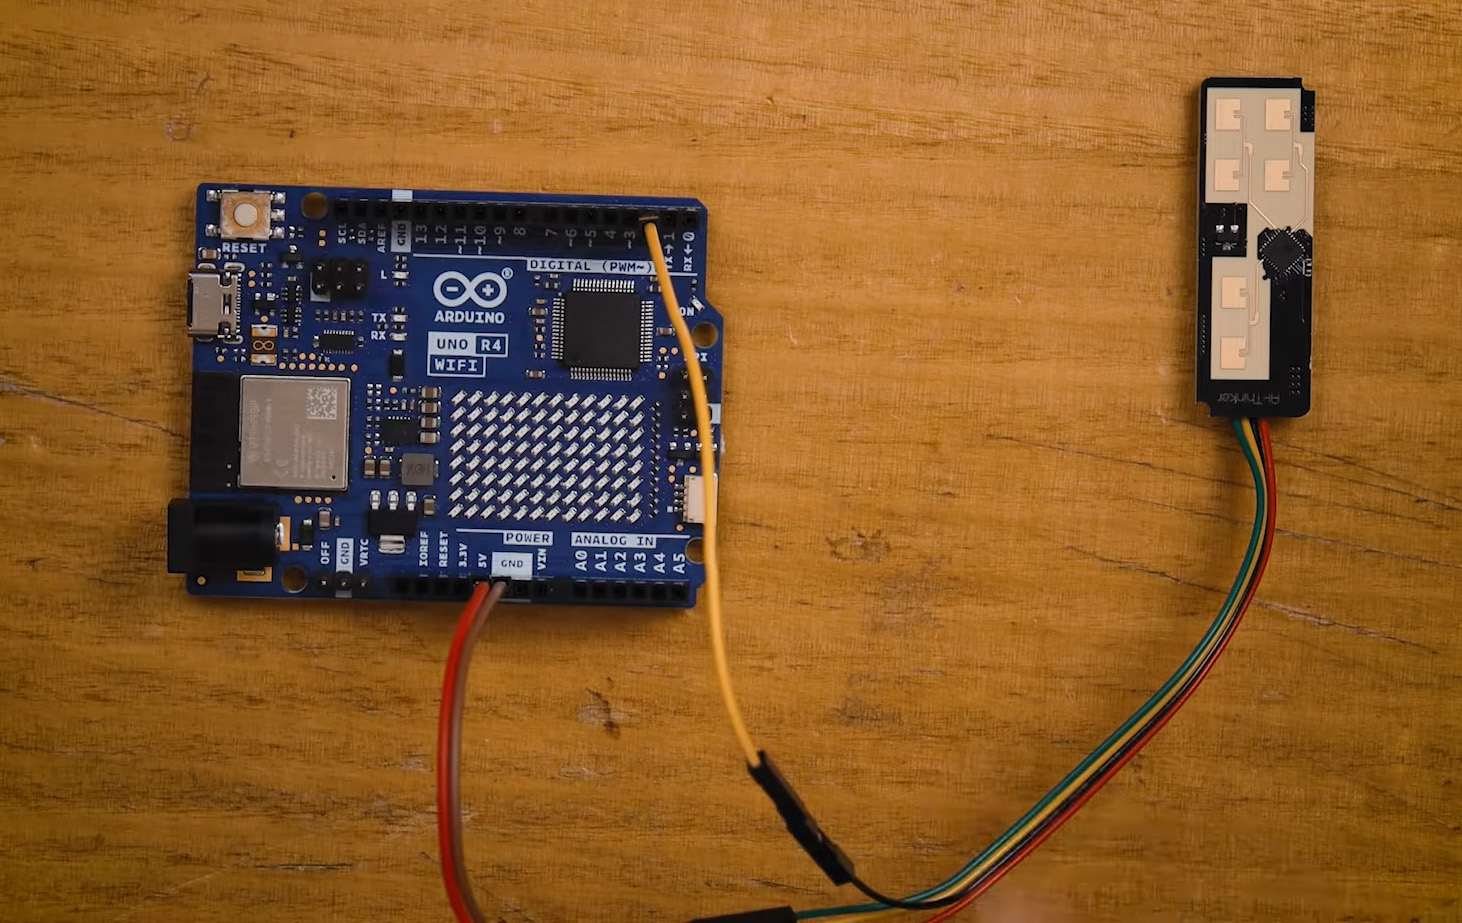
Speaking of pin 3, do not connect it. The radar runs on 3.3-volt logic and the Arduino runs on 5-volt logic, and we might damage something if we are not careful here. Right now we transmit a 3.3-volt signal on the radar and receive it on pin 2, which can handle up to 5 volts. But if we connected Pin 3 to the RX or receiver pin of the radar and sent data, we would be sending a 5-volt signal to a pin that is only rated to 3.3 volts. This could potentially damage the radar sensor! So we are not going to make that connection and leave it at these 3 wires as we are only going to be receiving data from the radar. If for some reason you want to send data to the radar, you will need a logic-level converter.
If not though, we are done with the wiring and ready to program our Arduino. Here's a quick summary of the connections we've made:
- Radar 5V pin → Arduino 5V
- Radar GND pin → Arduino GND
- Radar TX pin → Arduino Pin 2
Programming the Arduino and Using the Library
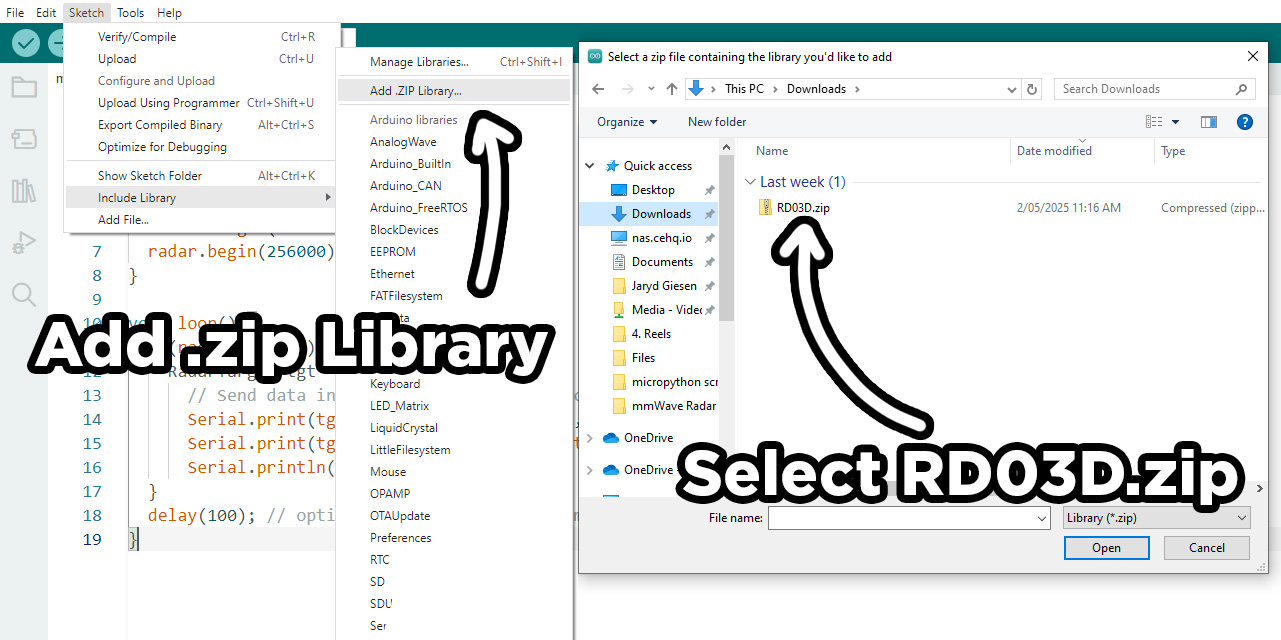
We have written a basic library that greatly simplifies the process of using the module and you can download it here:
Download the zip file (do not unzip it), then in the Arduino IDE select Sketch > Include Library > Add .ZIP Library and then open RD03D.zip.
This library not only hides a lot of the complexities of decoding the messages from the sensor but also deals with the UART interactions for us as well. The code below is a demo of how to use the library:
#include <RadarSensor.h>

RadarSensor radar(2,3); // RX, TX pins to sensor TX, RX pins

void setup() {
  Serial.begin(115200);
  radar.begin(256000);
  Serial.println("Radar Sensor Started");
}

void loop() {
  if(radar.update()) {

    RadarTarget tgt = radar.getTarget();
    Serial.print("X (mm): "); Serial.println(tgt.x);
    Serial.print("Y (mm): "); Serial.println(tgt.y);
    Serial.print("Distance (mm): "); Serial.println(tgt.distance);
    Serial.print("Angle (degrees): "); Serial.println(tgt.angle);
    Serial.print("Speed (cm/s): "); Serial.println(tgt.speed);
    Serial.println("-------------------------");
    delay(100);
    }
}
Paste in this sample code to the IDE, compile and upload, and you should start getting some detection data coming from the Arduino. We will look at this output in a bit, but first lets look at how the code uses the library.
Starting off, it imports the library and then creates an instance of the radar. This line takes in 2 numbers which are the pins to set up the RX and TX pins on. The library will use software serial to set simulate UART on these two pins and in this guide we are using 2 and 3, but you can use any other pair of pins you wish.
#include <RadarSensor.h>

RadarSensor radar(2,3); // RX, TX pins to sensor TX, RX pins
Then we set up the serial connection of our USB connection and UART connection to the radar. For our USB connection we are using a Baud rate of 115,200, but you can use any speed that your project calls for. Do not change the buad rate of the radar connection as it only operates at a rate of 256,000.
void setup() {
  Serial.begin(115200);
  radar.begin(256000);
  Serial.println("Radar Sensor Started");
}
Then we finally get the data from the radar through the library. By calling radar.update(), we tell the library to try and get the latest reading from the radar and this will return true if it gets a valid reading. We do a clever trick here and put the line in an if statement which not only updates the library, but will execute the code we put inside the if statement when we get that valid reading. Inside that loop we start by getting the target data with radar.getTarget() and we store it in a variable called tgt.
void loop() {
  if(radar.update()) {

    RadarTarget tgt = radar.getTarget();
    Serial.print("X (mm): "); Serial.println(tgt.x);
    Serial.print("Y (mm): "); Serial.println(tgt.y);
    Serial.print("Distance (mm): "); Serial.println(tgt.distance);
    Serial.print("Angle (degrees): "); Serial.println(tgt.angle);
    Serial.print("Speed (cm/s): "); Serial.println(tgt.speed);
    Serial.println("-------------------------");
    delay(100);
    }
}
All of our radar information is now stored in the tgt variable (or whatever name you choose for this variable). To get information out of it, we simply need to do the following. Note that each line is 2 print statements one after the other and in the second one we extract the information out of it.
    Serial.print("X (mm): "); Serial.println(tgt.x);
    Serial.print("Y (mm): "); Serial.println(tgt.y);
    Serial.print("Distance (mm): "); Serial.println(tgt.distance);
    Serial.print("Angle (degrees): "); Serial.println(tgt.angle);
    Serial.print("Speed (cm/s): "); Serial.println(tgt.speed);
    Serial.println("-------------------------");
    delay(100);
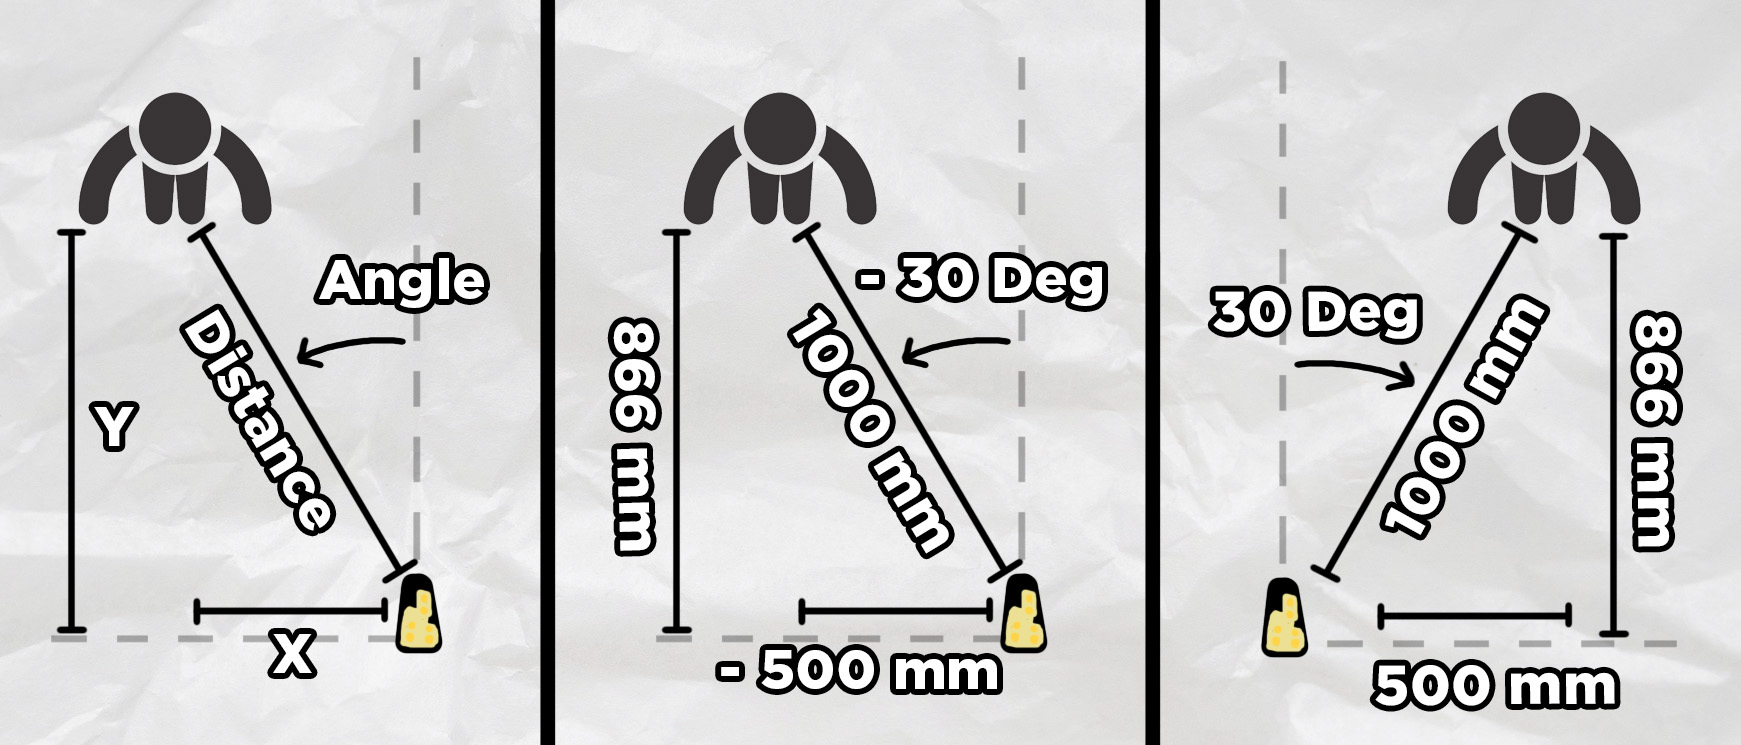
Running this code you should see a few bits of positional data being output. Distance, angle and speed are all pretty straightforward, but the x and y can be a bit tricky. The X-axis is a measurement of how far a person is away from the centre line of the radar, and the Y-axis is a measurement of how far a person is from the parallel of the radar. The image below shows both of these. Also note that both the X-axis measurement and angle have positive and negative values which are also shown in the image below. The maximum angles of this sensor range from -60 degrees to +60 degrees.
Some quick tips on using this in your project:
- This is only set up to detect one person. If you have multiple people in front of the sensor, it will track the person with the strongest return - this is usually the person who is the closest to it.
- If you are going to mount this somewhere to detect people, place it between chest and head height for the best results.
- Radio waves will bounce off surfaces. When testing it, sometimes I was directly behind a sensor yet it was picking up phantom targets several meters away. This was the radar waves bouncing off the wall and seeing me in the reflection like a mirror. If there are random readings it is not a ghost, it is likely picking up a reflection of a person.
- If you are using multiple of these sensors they will interfere. Ensure they are far enough apart from each other so that they don't pick up each other's signals.
Radar Visualisation with Processing IDE
Let's do one more thing before we finish up and visualise that data with Processing IDE, a fantastic open-source cross-platform program that is an easy way to create visuals like a radar. Once you have installed it, copy and paste the following code into the Arduino IDE and upload it to your board:
#include <RadarSensor.h>

RadarSensor radar(2,3); // RX, TX sensor pins

void setup() {
  Serial.begin(115200);
  radar.begin(256000);
}

void loop() {
  if(radar.update()) {
    RadarTarget tgt = radar.getTarget();
      // Send data in CSV form: angle, distance, speed
      Serial.print(tgt.angle); Serial.print(",");
      Serial.print(tgt.distance); Serial.print(",");
      Serial.println(tgt.speed);   // endline to finish each data block
  }
  delay(100); // optional delay for stable communication
}
This code is extremely similar to before but outputs the distance, angle and speed in a CSV format. Once that is uploaded to the board we now have a device that outputs the radar readings over USB when ever we plug it in. Go ahead an open up Processing IDE and paste in the following code:
import processing.serial.*;

Serial radarPort;
float angle, distance, speed;

int radarRadius;
PFont radarFont;

void setup() {
  size(1600, 900);
  radarRadius = height - 150;
  radarFont = createFont("Arial", 16);
  textFont(radarFont);
  radarPort = new Serial(this, "COM5", 115200);
  radarPort.bufferUntil('\n');

  angle = 0;
  distance = 0;
  speed = 0;
}

void draw() {
  background(0);
  translate(width/2, height - 70);
  drawRadarDisplay();
  displayTarget(angle, distance, speed);
}

void serialEvent(Serial port) {
  String in = port.readStringUntil('\n');
  if(in != null){
    in = trim(in);
    String[] values = split(in, ',');
    if(values.length == 3){
      angle = float(values[0]);
      distance = float(values[1]);
      speed = float(values[2]);
    }
  }
}

void drawRadarDisplay(){
  stroke(0, 255, 0);
  strokeWeight(1);
  noFill();

  // Arcs from -60° to +60°
  for(int r = radarRadius/4; r <= radarRadius; r += radarRadius/4) {
    arc(0, 0, r*2, r*2, radians(-150), radians(-30));
  }

  // Explicitly draw lines at every required angle (-60, -45, -30, -15, 0, 15, 30, 45, 60)
  int[] angles = {-60, -45, -30, -15, 0, 15, 30, 45, 60};

  for(int i = 0; i < angles.length; i++){
    float currentAngle = angles[i];
    float rad = radians(currentAngle - 90);
    float x = radarRadius * cos(rad);
    float y = radarRadius * sin(rad);

    strokeWeight(1);
    stroke(0, 255, 0);
    line(0, 0, x, y);

    fill(0, 255, 0);
    noStroke();
    textAlign(CENTER, CENTER);
    textSize(14);

    float tx = (radarRadius + 20) * cos(rad);
    float ty = (radarRadius + 20) * sin(rad);
    text(currentAngle + "°", tx, ty);
  }

  // center vertical line at 0 degrees upwards
  stroke(0,255,0);
  line(0,0,0,-radarRadius);
}

void displayTarget(float angleDeg, float distanceMM, float spd){
  if(distanceMM <= 8000){
    float scaledDist = map(distanceMM, 0, 8000, 0, radarRadius);
    float rad = radians(angleDeg - 90);
    float x = scaledDist * cos(rad);
    float y = scaledDist * sin(rad);

    fill(255,0,0);
    noStroke();
    ellipse(x,y,14,14);

    fill(255);
    textSize(16);
    textAlign(LEFT, CENTER);
    text("Angle: " + nf(angleDeg,1,1) + "°", -width/2 + 20, -radarRadius - 50);
    text("Distance: " + nf(distanceMM/1000.0,1,2) + " m", -width/2 + 20, -radarRadius - 25);
    text("Speed: " + nf(spd,1,2) + " cm/s", -width/2 + 20, -radarRadius);
  }
}
This code is going to take the formatting messages being sent by the Arduino and visualise them in a display. Explaining this code is outside the scope of this guide, but large language models like ChatGPT and Claude are fluent in this Processing IDE language. Before you run the code you will need to input the correct COM port of your Arduino which can be easily found in the Arduino IDE in the top row. Change the COM port number in the Processing IDE code which should be at line 14 - by default it is COM5. You will also need to close the Arduino IDE as the serial monitor will be connected to the COM port and reading data from it which will block Processing IDE from using it.
Once it's closed, run the Processing code and you should see something like the radar visualisation on the right. The circular lines are 2-meter markers and the visualisation extends to the maximum 8-meter range of the sensor. This is a great deal of fun to play around with, and it's a helpful tool in a project using this sensor as it helps visualise information.

Where to From Here?
We now know how to use a sensor that beams out invisible radio waves and uses advanced processing algorithms to detect and track humans. There are a great deal of applications for this, but if you are looking for some inspiration, we had 3 projects come to mind that we weren't able to fit into this guide:
- A human speedometer - Using this sensor you could track the top speed of a person being detected (converting it to km/h or mph), and create a device that accurately measures how fast a person is running. A small OLED screen would be a great way to visualise this information when it's deployed.
- A more advanced home automation sensor - PIR sensors are great, but having distance, direction and speed at your fingertips is a great addition to any sort of home automation setup. This might work better when implemented on an ESP32 though.
- Fan tracking - On my desk, I have a fan that I have to shift every time I move. Having it on a rotating platform with the sensor tracking a person to directly blow air on them would be great (especially for the Australian summer heat).
Regardless, if you do make something cool with it, or you need a hand with anything from this guide, feel free to drop a comment in the forum below, we are all makers and happy to help. Until next time, happy making!

